File under: development, go, golang, tagdb, boltdb, benchmarking, optimisation
blog / Random Access Madness
Tracking down bad random access patterns in a disk database
TagDB uses BoltDB for its disk storage. BoltDB is a key-value database that provides fast read access with lots of features that I want, like the ability to iterate over keys and even indexes on keys. However, it clearly wasn't designed for the kind of work TagDB does. In my initial tests with a couple of records, BoltDB worked nicely. Then I threw a lot of records at it, and things started going less nice.
Looking at the logs, I discovered that we're only storing around 8 records per second. True, this is on my weak dev machine, but that's still much too low for a system where I want to store 1000s of records per second. Worse, as the number of tags grows, the performance rapidly gets much worse. What's going on?
2015/03/02 14:48:31 Storing record with  8  tags
2015/03/02 14:48:31 Storing record with  8  tags
2015/03/02 14:48:31 Storing record with  8  tags
2015/03/02 14:48:31 Storing record with  8  tags
2015/03/02 14:48:31 Storing record with  8  tags
2015/03/02 14:48:31 Storing record with  8  tags
2015/03/02 14:48:31 Storing record with  8  tags
2015/03/02 14:48:33 Storing record with  10  tags
2015/03/02 14:48:33 Storing record with  11  tags
2015/03/02 14:48:34 Storing record with  10  tags
2015/03/02 14:48:35 Storing record with  14  tags
minutes:21
get/create_symbol_cache_hit:8155
get/create_symbol_cache_miss:1671
symbol_cache_miss:3060

string_cache_hit:928
string_cache_miss:392

tag_cache_hit:15779
tag_cache_miss:587

database_searches:801
records_fetched:99283
record_cache_hit:99283

boltdb_update:2190
boltdb_put:11762
boltdb_view:4039
It's good advice to collect statistics. In this case however, the statistics aren't telling us much. The caches are all working well, nothing seems particularly wrong. Let's look at the system monitor and..
We see this:

Wow. The response time has blown out to 3 seconds. Starting a new desktop program confirms this, the disk system is working terribly badly. Clearly TagDB is putting the the disk under terrible load.
Or not
{{% thumbnail src="/blog/light_system_load.png" %}}
What's going on? The CPU is quiet, so we're not being overwhelmed processing data. The memory use is tiny. And so is the disk use. The problem is a combination of random access seeking, and constant syncing. BoltDB is a good conscientious database that takes care of your data. It uses copy-on-write to allow simultaneous read/write access. It syncs updates to disks carefully. It takes care to do the right thing. When we combine BoltDB with randomly updating thousands of keys per second, as we do in TagDB, we hit BotlDB with the absolutely worst possible access pattern - we force it to update most of its database store over and over again, causing it to write back most of the database each update. And then sync it. Whoops. BoltDB performs superbly when we query it, but the price we pay is slow updates. Since we do a lot of updates in a short space of time, we are triggering the worst possible performance from BoltDB.
To see what my dev machine could handle, if we used different access patterns, I wrote some quick routines to dump out the memory silos and reload them. The dump is just opening a file, then a standard write to the filehandle. No tricks, just gigabytes of serialised data structures. This isn't a realistic approach to data storage, but it does give us a nice way to save the memory silos to disk during a server restart.
TagDB can run in permanent disk mode, ephemeral memory mode, or a combination of both, where the memory silos handle burst traffic, then trickle it back to the disk silos during slow periods. Dumping the memory silos to disk gives us some idea of the maximum possible transfer rates.
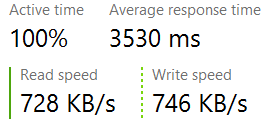
That's better

That's a 30x improvement over the random access version. For larger data sets, saving multiple gigs per silo, the transfer rate was even higher. It's a common piece of wisdom that is often repeated: random disk access is slow, avoid it where possible. But I haven't seen it illustrated so dramatically for a long time.
I don't keep many metrics for memory access (yet), but the few I keep are illuminating.
minutes:12
get/create_symbol_cache_hit:396303
get/create_symbol_cache_miss:55581
symbol_cache_miss:92871
So it's back to the drawing board. With the code I put in place to checkpoint the memory silos, it would be possible to run the database entirely in memory, and just save to disk every minute or two. However I expect that users will be storing many tibibytes of data, and so some level of disk persistence is necessary, as very few places have the resources to buy that much RAM.
In the meantime, I will continue using BoltDB, after I change the code to avoid bad random-access patterns. And there's alway levelDB to try, as well. If I were working in C, I would mmap my data structures to disk files, as I did for my Entirety map project. Golang has a mmap library, but I need to do a lot more research and testing to see if it will work with Go's approach of copying strings and arrays.